TEL:+86 132 6656 7067




Optical receiver sensitivity testing measures the minimum optical input power required for a receiver to maintain the specified bit-error performance. It is a key test for optical transceivers, helping evaluate link margin, BER performance, overload range, temperature stability, and long-distance transmission capability.
1. What Is Optical Receiver Sensitivity?
Optical receiver sensitivity is the minimum optical power required at the receiver input to achieve a specified performance level, normally defined by a target BER or other applicable measurement condition.
A more sensitive receiver can correctly recover a weaker optical signal, which can increase the available link margin for a given optical system.
2. Why Test Receiver Sensitivity?
Receiver sensitivity testing verifies whether an optical receiver meets its specified performance and determines how much optical attenuation the link can tolerate before reaching its performance limit.
It is particularly important for long-reach optical transceivers where fiber loss, connector loss, and other optical penalties consume a significant part of the available power budget.
3. Receiver Sensitivity vs Transmit Power
Transmit power describes the optical power launched into the fiber, while receiver sensitivity describes the minimum optical input required by the receiver.
The difference between available launch power and required receiver sensitivity forms an important part of the optical link budget.
4. Optical Receiver Sensitivity and Link Budget
A simplified link budget can be expressed as:
Available Optical Margin = Transmit Optical Power − Total Link Loss − Receiver Sensitivity
The calculation must also account for connector loss, splice loss, dispersion-related penalties, WDM components, and an appropriate engineering margin where applicable.
5. Main Equipment for Receiver Sensitivity Testing
A typical laboratory setup may include an optical transmitter or reference source, optical attenuator, optical power meter, BER tester, optical switch or fiber fixtures, and the receiver or optical transceiver under test.
An oscilloscope or compliance test system can be added when waveform or eye-quality measurements are required.
6. Basic Receiver Sensitivity Test Setup
A simplified test path is:
Optical Source → Variable Optical Attenuator → Receiver Under Test → BER Tester
The attenuator is used to reduce the optical input gradually while the receiver performance is continuously monitored.
7. Calibrating the Test Setup
Calibration is critical because receiver sensitivity is often measured near very low optical power levels. Before testing, verify the output of the optical source and the attenuation value using calibrated measurement equipment.
Incorrect calibration can shift the reported sensitivity and produce misleading results.
8. Optical Power Measurement
Measure the optical power at the receiver input after the attenuation stage. The measurement point should represent the actual power entering the receiver under test.
Connector adapters, patch cords, and test fixtures can introduce additional loss, so they should be included in the calibration process.
9. Selecting the Test Pattern
The test pattern can influence receiver performance. The selected pattern should match the applicable specification or compliance procedure.
For high-speed transceivers, standardized stress patterns may be used to evaluate receiver performance under controlled and repeatable conditions.
10. BER Testing
Bit Error Rate testing determines how many transmitted bits are incorrectly recovered by the receiver. Receiver sensitivity is normally determined by finding the optical input level at which the receiver reaches the specified BER threshold.
11. Pre-FEC BER and Post-FEC BER
Modern high-speed systems may use Forward Error Correction. Testing should clearly identify whether BER is measured before or after FEC processing.
A post-FEC error-free result does not necessarily mean that the optical receiver has a large raw signal margin.
12. Sensitivity Measurement by Optical Attenuation
One common method is to begin with a relatively strong optical input and gradually increase attenuation. At each step, record the received optical power and BER.
The resulting data can be used to generate a sensitivity curve and identify the receiver's operating limit.
13. Receiver Sensitivity Curve
A sensitivity curve plots BER against received optical power. As attenuation increases, received power decreases and BER generally increases once the receiver approaches its sensitivity limit.
This curve provides more information than a single sensitivity value because it shows how rapidly performance degrades near the operating threshold.
14. Sensitivity Threshold
The sensitivity threshold is the specified received optical power associated with the target BER or measurement condition.
For example, a receiver specification may define sensitivity at a particular BER, allowing different receivers to be compared under the same test condition.
15. OMA Sensitivity
For some high-speed optical interfaces, receiver sensitivity is specified using Optical Modulation Amplitude rather than average optical power.
OMA-based sensitivity is particularly relevant to modern PAM4 systems where signal amplitude information provides a more useful representation of receiver performance than average power alone.
16. Average Power Sensitivity vs OMA Sensitivity
| Parameter | Meaning |
|---|---|
| Average optical power | Overall optical power entering the receiver |
| OMA | Optical modulation amplitude of the signal |
| Receiver sensitivity | Minimum input level meeting the specified performance |
| Receiver overload | Maximum input level for specified operation |
17. Receiver Overload Testing
Receiver testing should not stop at the sensitivity point. Overload testing evaluates how the receiver behaves when the optical input becomes too strong.
A complete receiver operating range is therefore defined by both the lower sensitivity limit and the upper overload limit.
18. Dynamic Range
Receiver dynamic range represents the usable optical input range between the sensitivity limit and overload limit under defined conditions.
A wider dynamic range can provide greater tolerance to variation in the optical channel.
19. Stressed Receiver Sensitivity
Stressed receiver sensitivity evaluates receiver performance under intentionally controlled optical impairments. The purpose is to verify receiver tolerance under more demanding signal conditions than a basic sensitivity measurement.
20. Why Stressed Testing Matters
A receiver can perform well with a clean optical signal but degrade when the signal has additional noise, distortion, or other specified stresses.
Stressed receiver testing provides a better indication of how the device may behave under realistic worst-case conditions.
21. Receiver Sensitivity and BER Threshold
There is no single sensitivity value without a defined performance criterion. A receiver can exhibit different sensitivity results depending on whether the target is a raw BER, a corrected BER, or another system-level requirement.
22. Receiver Sensitivity and Data Rate
Higher data rates generally place greater demands on the receiver. As signaling speed increases, the receiver must process faster transitions and maintain sufficient signal-to-noise performance.
This is one reason receiver sensitivity specifications should always be compared at the same data rate and test condition.
23. Receiver Sensitivity for NRZ
NRZ uses two primary signal levels and has a relatively large eye opening compared with PAM4 at the same general signaling generation. Receiver sensitivity testing for NRZ typically focuses on average input power, BER, and other applicable optical and electrical parameters.
24. Receiver Sensitivity for PAM4
PAM4 uses four signal levels and therefore has smaller individual eye openings. Receiver performance becomes more sensitive to noise, distortion, crosstalk, and other impairments.
For 400G, 800G, and higher-speed applications, OMA, stressed sensitivity, TDECQ, and other signal-quality parameters may be important in addition to average optical power.
25. Receiver Sensitivity and Optical Signal Quality
Receiver sensitivity depends not only on total optical power but also on the quality of the incoming optical signal. Noise, extinction ratio, waveform distortion, wavelength characteristics, and reflections can all affect receiver performance.
26. Receiver Sensitivity and Optical Noise
Optical noise reduces the effective signal-to-noise ratio available to the receiver. This can cause errors even when the average received optical power appears sufficient.
Long-distance and amplified optical systems are particularly sensitive to accumulated optical noise.
27. Receiver Sensitivity and Chromatic Dispersion
Chromatic dispersion can broaden and distort high-speed optical signals as they travel through fiber. The impact becomes more significant as transmission distance and signaling speed increase.
Receiver sensitivity testing over a stressed or dispersive optical path can therefore provide additional information beyond a short clean-fiber test.
28. Receiver Sensitivity and Optical Return Loss
Reflections caused by connectors, adapters, or other discontinuities can degrade signal quality. Excessive reflection can reduce receiver margin even when measured average input power remains within specification.
29. Receiver Sensitivity and Fiber Attenuation
Fiber attenuation directly reduces the amount of optical power reaching the receiver. The longer the fiber path, the more important the receiver sensitivity becomes when determining whether sufficient link margin remains.
30. Receiver Sensitivity Testing for 100G
100G optical transceivers can use different architectures, including LR4, ER4, DR, and other designs. Receiver sensitivity must therefore be evaluated against the specific optical interface, wavelength architecture, modulation format, and target reach.
31. Example: 100G QSFP28 ER4 Receiver Sensitivity
The C-LIGHT CL100GQSFPER4 specifies an OMA receiver sensitivity of up to -21.4dBm per lane and a stressed receiver sensitivity of -18dBm per lane.
These values must be interpreted together with the module's transmitter power, optical penalties, fiber loss, and target 40km link design.
32. Receiver Sensitivity Testing for 400G
400G optical modules can use multiple optical lanes and different wavelength architectures. Testing should evaluate each lane independently where applicable.
A single weak lane can reduce overall link performance even if the other channels meet their specifications.
33. Receiver Sensitivity Testing for 800G
At 800G, receiver testing becomes more demanding because lane rates are higher and the optical architecture can include multiple PAM4 lanes or wavelength channels.
The test should account for lane-specific sensitivity, optical power balance, signal quality, and the applicable system-level error requirements.
34. Receiver Sensitivity Testing for 1.6T
1.6T receivers operate at even higher lane rates, commonly using 200G-class lanes in many datacenter architectures. Receiver sensitivity testing becomes increasingly dependent on electrical and optical signal quality, DSP architecture, and host-channel conditions.
35. Receiver Sensitivity and DSP
Digital signal processing can compensate for certain signal impairments and improve the usable performance of a high-speed receiver.
When testing a module with an integrated DSP, distinguish between the native optical receiver characteristics and the final system performance after digital processing.
36. Receiver Sensitivity and FEC
FEC can allow a system to operate with a higher raw error rate while maintaining an acceptable corrected error rate. This improves effective system robustness but does not change the physical optical power entering the receiver.
37. Receiver Sensitivity and Link Margin
Link margin is the difference between the available optical power at the receiver and the receiver's required sensitivity, after accounting for other link penalties.
A higher receiver sensitivity can increase the margin available to the system, provided the transmitter and optical path are also adequate.
38. Engineering Margin
Designing a link exactly at the measured sensitivity limit is not recommended. Engineering margin provides tolerance for fiber aging, connector contamination, temperature variation, repairs, component variation, and future changes in the optical path.
39. Temperature Effects on Sensitivity
Receiver sensitivity can change with temperature because photodetector characteristics, transimpedance amplifiers, DSP behavior, and other electronic components can vary across the operating range.
40. High-Temperature Receiver Testing
At elevated temperature, monitor receiver sensitivity, optical power, electrical behavior, and module diagnostics. A receiver that passes at room temperature may exhibit reduced margin at the upper end of its operating range.
41. Low-Temperature Receiver Testing
Low-temperature testing evaluates startup, steady-state operation, sensitivity, and signal recovery under cold conditions. The receiver should remain within its specified performance limits.
42. Temperature Cycling
Temperature cycling can reveal intermittent receiver problems, packaging issues, optical coupling instability, and other failures that may not appear during a constant-temperature test.
43. Receiver Sensitivity Test Repeatability
Repeatability is important for comparing modules and identifying manufacturing variation. Use the same optical source, attenuation method, test pattern, BER threshold, and calibration procedure for each measurement.
44. Measurement Uncertainty
Measurement uncertainty can arise from optical power meter accuracy, attenuator accuracy, connector repeatability, reference source stability, fiber loss, and test equipment calibration.
Near the sensitivity limit, even a small measurement error can materially affect the reported result.
45. Connector and Adapter Loss
Every connector and adapter in the test setup can add loss. Unnecessary connection points should be minimized, and the complete fixture should be characterized before sensitivity measurements begin.
46. Fiber Patch Cord Selection
Use appropriate single-mode or multimode patch cords according to the receiver under test. The fiber type, connector polish, length, and quality should match the test requirements.
47. Optical Attenuator Selection
The attenuator must provide sufficient attenuation range, accuracy, wavelength compatibility, and power handling capability.
For low-power sensitivity measurements, insertion loss accuracy and repeatability are particularly important.
48. Reference Optical Source
The optical source should provide a stable and controlled signal that matches the required wavelength, modulation format, lane rate, and test pattern.
49. Receiver Sensitivity Testing with an Optical Transceiver
When testing an integrated transceiver, the module must be connected to an appropriate host or test platform. The host can affect electrical signaling, module configuration, diagnostics, and overall test behavior.
50. Receiver Sensitivity vs Module Specification
Always compare the measured value with the exact product specification. Different transceiver models can have different sensitivity definitions, BER thresholds, wavelengths, lane rates, and receiver architectures.
51. Receiver Sensitivity Test Procedure
A practical procedure can follow these steps:
1. Inspect and clean connectors → 2. Warm up equipment → 3. Calibrate optical power → 4. Connect the receiver → 5. Establish the reference BER → 6. Increase attenuation step by step → 7. Record received power and BER → 8. Determine the sensitivity point → 9. Repeat for all lanes → 10. Verify temperature and repeatability
52. Determining the Sensitivity Point
The sensitivity point is obtained by identifying the received optical power at the specified BER threshold. For higher accuracy, measure several points around the threshold rather than relying on one observation.
53. Binary Search Testing Method
A binary-search approach can reduce test time. Start with a known passing optical power and a known failing level, then progressively narrow the range until the sensitivity threshold is identified.
54. Step Attenuation Method
A step method increases attenuation by fixed increments and records the corresponding BER. It is simple and suitable for production or screening environments where repeatability and speed are important.
55. Continuous Sweep Testing
A variable attenuator can also be used to sweep received power continuously while BER and other receiver parameters are recorded. This can provide a detailed sensitivity curve for engineering analysis.
56. Production Receiver Sensitivity Testing
Production testing generally uses a simplified and repeatable procedure designed to confirm that each module remains within its acceptance limits.
The test may use predetermined attenuation points instead of fully characterizing the sensitivity curve for every unit.
57. Engineering Characterization
Engineering validation normally performs a much more detailed analysis, including sensitivity curves, temperature sweeps, stressed conditions, lane comparison, optical power variation, and long-duration testing.
58. Receiver Sensitivity in Multi-Lane Modules
For 100G, 400G, 800G, and 1.6T transceivers, testing should account for the multi-lane architecture. Individual lanes can exhibit different optical power, receiver sensitivity, or electrical performance.
59. Worst-Lane Analysis
The worst-performing lane should be identified rather than evaluating only the average result. The weakest lane can determine whether the complete transceiver satisfies the required system margin.
60. Receiver Sensitivity and Lane Imbalance
Large lane-to-lane variation can indicate differences in optical coupling, photodetector performance, TIA gain, electrical path quality, or optical signal conditions.
61. Receiver Sensitivity and Wavelength
Receiver performance can vary across wavelength depending on the photodetector, optical filter, coupling structure, and receiver architecture.
For multi-wavelength transceivers, receiver sensitivity should therefore be checked for every channel where applicable.
62. Receiver Sensitivity for CWDM and LAN-WDM
CWDM and LAN-WDM transceivers use multiple wavelengths, so each wavelength can have different optical characteristics.
Testing should confirm that every required channel meets the specified receiver performance.
63. Receiver Sensitivity and APD
Avalanche photodiodes can provide internal gain and are used in some longer-reach optical receivers. APD-based receivers can achieve high sensitivity, but their performance also depends on bias conditions, temperature, noise, and associated electronics.
64. Receiver Sensitivity and PIN Photodiodes
PIN photodiodes are widely used in optical receivers, particularly for short- and medium-reach systems. Their sensitivity depends on responsivity, receiver noise, bandwidth, TIA performance, and signal characteristics.
65. APD vs PIN Receiver Sensitivity
| Feature | PIN | APD |
|---|---|---|
| Internal gain | No | Yes |
| Typical complexity | Lower | Higher |
| Sensitivity potential | Good for many applications | Can provide higher sensitivity |
| Temperature dependence | Moderate | More significant |
66. Receiver Sensitivity and TIA
The transimpedance amplifier converts the photodetector's current into a voltage signal that can be processed by the receiver electronics.
TIA noise, bandwidth, gain, and linearity directly affect receiver sensitivity.
67. Receiver Sensitivity and Clock Recovery
High-speed receivers must recover timing information from the incoming signal. Poor signal quality can make clock recovery more difficult and increase errors near the sensitivity limit.
68. Receiver Sensitivity and Equalization
Equalization can compensate for certain frequency-dependent distortions in the electrical receiver path. However, equalization does not eliminate the fundamental optical noise limit of the receiver.
69. Receiver Sensitivity and Jitter
Excessive jitter can reduce the timing margin of a high-speed signal. When combined with low optical input power, it can cause a rapid increase in BER.
70. Receiver Sensitivity and Eye Closure
Eye closure indicates degraded signal quality. In PAM4 systems, individual eye openings can become particularly small under weak-signal or stressed conditions.
71. Receiver Sensitivity and Long-Distance Links
For long-distance optical links, receiver sensitivity becomes one of the key parameters determining the achievable reach. The available margin must account for the complete optical path rather than receiver sensitivity alone.
72. Receiver Sensitivity Testing for DCI
Data Center Interconnect links can involve DWDM components, amplifiers, ROADMs, long fiber spans, and multiple connectors. Sensitivity testing for DCI should therefore consider realistic optical system impairments.
73. Coherent Receiver Sensitivity
Coherent receivers use a local oscillator and coherent detection architecture. Their performance is often characterized using optical signal-to-noise ratio, required OSNR, BER, and other coherent-specific parameters in addition to simple received power.
74. Coherent vs Direct-Detection Receiver Testing
| Feature | Direct Detection | Coherent |
|---|---|---|
| Primary measurement | Received power and BER | OSNR, BER, received signal quality |
| DSP complexity | Lower to moderate | High |
| Typical reach | Short to moderate | Metro to long-haul applications |
75. Common Receiver Sensitivity Test Failures
Common failures include poor calibration, excessive fixture loss, unstable optical source, incorrect test pattern, insufficient optical power range, connector contamination, temperature drift, electrical signal problems, and actual receiver degradation.
76. Test Setup Failure vs Receiver Failure
Before replacing a receiver, verify the test setup. Replace or recheck patch cords, connectors, attenuators, optical sources, and reference instruments before concluding that the module itself has failed.
77. Unexpectedly Poor Sensitivity
Unexpectedly poor sensitivity can result from optical misalignment, photodetector degradation, TIA noise, inadequate bias, DSP configuration, electrical signal integrity, or an incorrect reference signal.
78. Sensitivity Good at Room Temperature but Poor at High Temperature
This pattern often indicates temperature-dependent optical or electrical behavior. Check receiver bias, TIA performance, module power, optical power, and host thermal conditions.
79. One Lane Has Poor Sensitivity
One weak lane usually points toward a lane-specific optical, electrical, or component issue. Compare the problematic lane with the other channels and inspect its optical power, wavelength, and signal quality.
80. Receiver Sensitivity and Module Aging
Receiver characteristics can change over the operating life of an optical module. Reliability testing and periodic system monitoring can help identify gradual degradation before the link becomes unstable.
81. Receiver Sensitivity Testing Standards
The exact sensitivity test method depends on the optical interface and applicable standard. Ethernet, InfiniBand, coherent optical, and other systems can use different test conditions, BER thresholds, and receiver stress definitions.
Always use the test procedure associated with the specific transceiver specification or applicable compliance requirement.
82. Production Acceptance Criteria
Production acceptance limits should be established from the applicable product specification and measurement uncertainty. A practical test limit should provide sufficient separation from the absolute specification boundary to reduce false pass or fail results.
83. Receiver Sensitivity Test Documentation
A test record should include module part number, serial number, wavelength, data rate, test pattern, temperature, optical input power, attenuation, BER, equipment calibration status, and test result.
84. Recommended Test Report
| Test Item | Recorded Data |
|---|---|
| Module | Part number and serial number |
| Wavelength | Test wavelength or channel |
| Data rate | Link speed and lane rate |
| Temperature | Test condition |
| Received power | Optical power at receiver input |
| BER | Measured error rate |
| Sensitivity | Threshold result |
| Overload | Maximum valid optical input |
85. Best Practices for Receiver Sensitivity Testing
Use calibrated equipment, minimize unnecessary connectors, clean all optical interfaces, stabilize the test environment, test individual lanes where applicable, distinguish pre-FEC from post-FEC results, and repeat measurements to verify consistency.
86. Receiver Sensitivity Testing for AI Data Centers
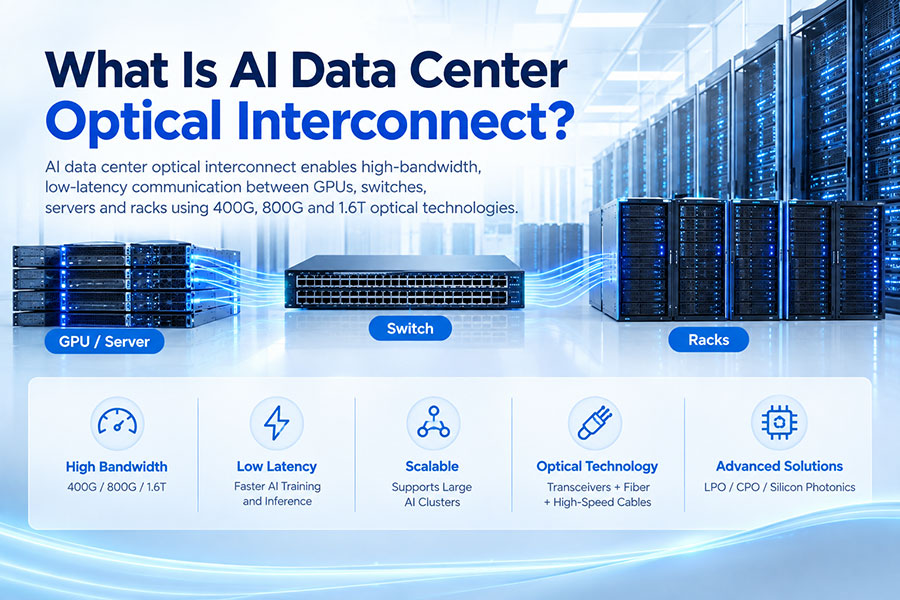
AI data centers increasingly use 400G, 800G, and 1.6T optical connectivity. Higher lane rates make receiver signal quality increasingly important, particularly in dense switch environments.
Receiver sensitivity should therefore be evaluated together with optical power, BER, signal integrity, temperature, and host compatibility.
87. Receiver Sensitivity and AI Optical Interconnect
AI optical interconnects can use DAC, AOC, optical transceivers, and coherent optics across different network layers. Receiver sensitivity is particularly relevant to the optical transceivers and longer links within the network fabric.
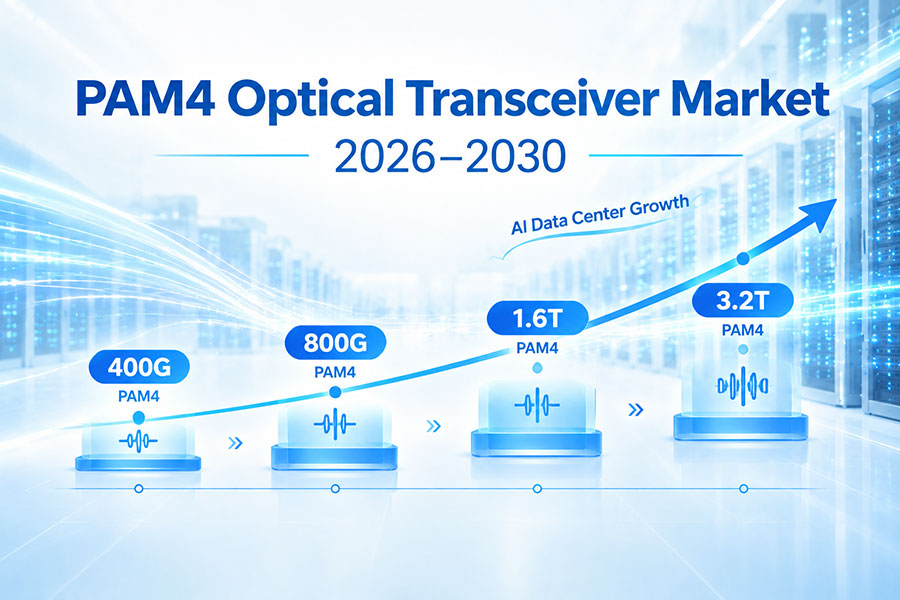
88. Receiver Sensitivity and 400G/800G/1.6T Evolution
As bandwidth increases from 400G to 800G and 1.6T, receiver testing becomes increasingly important because higher lane rates create tighter electrical and optical margins.
89. How to Interpret a Receiver Sensitivity Result
A more negative sensitivity value generally indicates that the receiver can operate with a weaker optical signal under the specified test condition. However, values should only be compared when the wavelength, data rate, BER criterion, modulation format, and test method are equivalent.
90. Receiver Sensitivity vs Real-World Link Performance
A receiver sensitivity result obtained in a controlled laboratory environment does not automatically predict complete field performance. The actual link also includes fiber attenuation, connectors, dispersion, reflections, temperature, transmitter performance, and other system impairments.
91. Complete Link Validation
After component-level sensitivity testing, validate the complete optical link under representative operating conditions. This can include actual fiber length, connectors, traffic, temperature, and host equipment.
92. Conclusion
Optical receiver sensitivity testing is a fundamental procedure for evaluating optical transceivers and receivers. It determines how weak an optical signal can become before the receiver reaches its specified performance limit.
A reliable test requires calibrated optical power, controlled attenuation, accurate BER measurement, appropriate test patterns, temperature control, and careful consideration of optical and electrical impairments.
For modern 100G, 400G, 800G, 1.6T, and coherent optical systems, receiver sensitivity should be evaluated together with OMA, stressed sensitivity, BER, optical power, signal quality, FEC behavior, and complete link margin. This provides a more accurate assessment of whether the receiver can operate reliably in the intended network.
 >
>

 >
>
 >
>
 >
>
 >
>
 >
>
 >
>
 >
>