TEL:+86 132 6656 7067





Optical signals lose power as they travel through fiber, and this gradual reduction directly influences how far a transmission system can operate reliably. Fiber attenuation determines how much signal power is consumed along the cable route, while connectors, splices, passive components, and installation conditions add further losses. When the total loss approaches the optical power budget of a transceiver, the receiver may no longer detect the signal with sufficient power for stable communication.
1. What Is Fiber Attenuation?
Fiber attenuation is the reduction in optical signal power as light propagates through an optical fiber. It is commonly expressed in decibels per kilometer (dB/km). A lower attenuation coefficient means that less optical power is lost over each kilometer of fiber.
For example, a fiber with an attenuation coefficient of 0.25 dB/km loses approximately 2.5 dB of optical power over a 10 km cable, excluding connector, splice, and other component losses. A higher coefficient produces greater power loss over the same distance.
Attenuation is not the same as dispersion. Attenuation reduces signal power, while dispersion spreads optical pulses over time. Both can restrict transmission distance, but they affect the optical signal in different ways.
2. What Causes Optical Fiber Attenuation?
Fiber attenuation comes from several physical mechanisms. Some are inherent to the glass material, while others result from cable installation, handling, or connection quality.
Material Absorption
Optical energy is absorbed by the fiber material and residual impurities. Modern fiber manufacturing reduces these losses through improved glass purity and manufacturing control.
Rayleigh Scattering
Microscopic variations in glass density and composition scatter a portion of the light. This is a fundamental loss mechanism and contributes to wavelength-dependent attenuation.
Bending Loss
Excessive bending can allow light to escape from the fiber. Macrobending and microbending may increase attenuation, particularly when cable routing or installation conditions are unsuitable.
Connection and Splice Loss
Misaligned connectors, contaminated end faces, poor fusion splices, and damaged interfaces introduce additional insertion loss into the optical link.
3. How Wavelength Affects Fiber Attenuation
Optical fiber does not have the same attenuation at every wavelength. Communication systems use wavelength windows where fiber loss is relatively low and suitable optical components are available.
| Wavelength | Typical Fiber Application | Indicative Attenuation | Common Use |
|---|---|---|---|
| 850 nm | Multimode fiber | Approximately 2.5–3.5 dB/km | Short-reach data center links |
| 1310 nm | Single-mode fiber | Approximately 0.33–0.40 dB/km | Metro and Ethernet links |
| 1550 nm | Single-mode fiber | Approximately 0.18–0.25 dB/km | Longer-reach and transport links |
These figures are indicative examples, not universal cable specifications. Actual attenuation depends on the fiber category, cable construction, manufacturer limits, and test wavelength. The cable datasheet and applicable cabling standard should be used for network design.
The 1550 nm window generally offers lower fiber attenuation than 1310 nm in conventional single-mode fiber. This makes it attractive for longer transmission paths. However, lower attenuation alone does not guarantee greater system reach: chromatic dispersion, optical amplifier characteristics, transceiver design, and other transmission constraints must also be considered.
4. Single-Mode and Multimode Fiber: Attenuation and Distance
Single-mode and multimode fiber are designed for different optical transmission conditions. Their attenuation characteristics, core structures, light sources, and supported Ethernet applications are not interchangeable.
| Fiber Type | Typical Wavelength | Indicative Attenuation | Typical Network Application |
|---|---|---|---|
| OM3 Multimode | 850 nm | Up to approximately 3.0 dB/km for commonly specified cable limits | 10G, 40G, and 100G short-reach links |
| OM4 Multimode | 850 nm | Up to approximately 3.0 dB/km for commonly specified cable limits | Higher-bandwidth data center links |
| OS2 Single-Mode | 1310 nm | Commonly specified at 0.4 dB/km maximum for outside-plant cable | Metro, access, and long-distance links |
| OS2 Single-Mode | 1550 nm | Commonly specified at 0.4 dB/km maximum for outside-plant cable | Longer-reach transmission and optical transport |
The attenuation figures above are cable specification examples. Actual installed cable performance may be better, and the exact limits should be checked against the manufacturer's datasheet.
More importantly, multimode transmission distance is also constrained by modal and chromatic dispersion. Therefore, a low attenuation measurement does not automatically mean that an OM3 or OM4 link can support the same distance as a single-mode link.
5. How Attenuation Limits Optical Transmission Distance
A transceiver sends optical power into the fiber, and the receiving module must detect enough power to maintain the required link performance. As the transmission distance increases, fiber attenuation consumes more of the available optical power budget.
The relationship can be expressed through the available power budget:
The available budget must accommodate fiber attenuation, connector insertion loss, splice loss, passive component loss, and an appropriate engineering margin.
| Loss Component | Calculation or Consideration | Effect on Link |
|---|---|---|
| Fiber attenuation | Attenuation coefficient × cable length | Increases with transmission distance |
| Connector loss | Insertion loss per mated connector pair | Reduces received optical power |
| Splice loss | Loss at each fusion or mechanical splice | Adds cumulative link loss |
| Passive component loss | Splitter, filter, WDM, or other component insertion loss | Consumes additional power budget |
| Engineering margin | Reserved allowance based on the system design | Provides tolerance for aging and future changes |
6. Practical Example: Calculating Transmission Distance
Consider a single-mode optical link with the following illustrative parameters:
| Parameter | Value |
|---|---|
| Minimum transmitter output power | -3 dBm |
| Receiver sensitivity | -18 dBm |
| Available optical power budget | 15 dB |
| Fiber attenuation coefficient | 0.25 dB/km |
| Connector and splice loss allowance | 2 dB |
| Reserved engineering margin | 3 dB |
First, calculate the available power budget:
Next, subtract the connection losses and reserved engineering margin:
The remaining loss allowance for the fiber itself is 10 dB. Divide this value by the fiber attenuation coefficient:
Under these simplified assumptions, the calculated fiber-loss allowance corresponds to 40 km. This is not a guaranteed 40 km transmission capability. The selected transceiver must support that reach, and the design must also satisfy dispersion, receiver overload, optical interface, and other system requirements.
7. How to Reduce Fiber Attenuation in Optical Networks
Reducing unnecessary loss helps preserve optical power margin and improves link stability. Good cable selection, installation practices, and testing are important throughout network deployment.
Select the correct fiber category: Use OS2 single-mode fiber for suitable longer-reach applications and OM3 or OM4 multimode fiber for supported short-reach connections.
Control cable bending: Follow the manufacturer's minimum bend-radius requirements during installation and maintenance.
Keep connector end faces clean: Inspect and clean optical interfaces before mating them. Contamination can increase insertion loss and reflection.
Improve splice quality: Use appropriate fusion-splicing procedures and verify splice performance.
Minimize unnecessary connections: Avoid adding excessive adapters, patch panels, and passive components to the optical path.
Measure installed link loss: Test at the wavelengths used by the optical system and compare the results with the link budget.
8. Fiber Attenuation in 400G and 800G Optical Networks
Higher-speed Ethernet networks place greater demands on optical components, fiber infrastructure, and link engineering. In 400G and 800G deployments, the selected transceiver application determines the supported fiber type, wavelength, connector arrangement, and transmission reach.
Short-reach multimode solutions are used in suitable data center architectures, while single-mode solutions support a wider range of reach requirements. For example, 400G and 800G DR, FR, and LR applications use different optical interfaces and reach specifications. Their supported distances cannot be determined from fiber attenuation alone.
400G Optical Transceiver Solutions
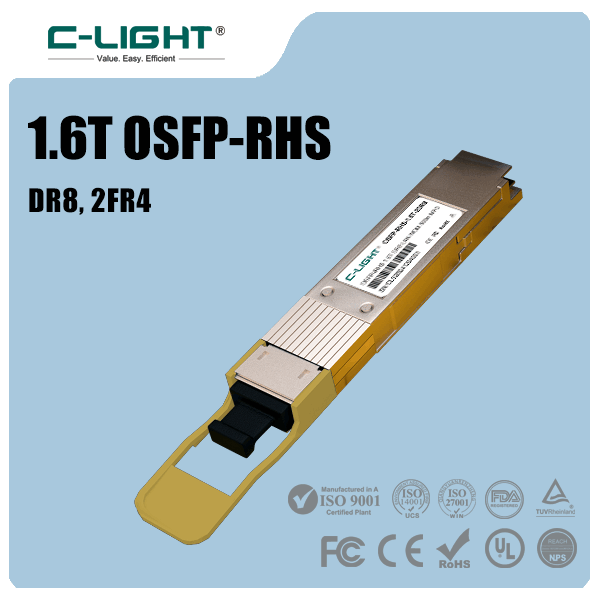
C-LIGHT provides 400G QSFP-DD and OSFP optical transceiver product families for high-speed data center and network connectivity. Select the appropriate optical application according to the required reach, fiber type, and host platform.
800G Optical Transceiver Solutions
800G QSFP-DD and OSFP platforms support high-bandwidth interconnect requirements in AI infrastructure and data center networks. The appropriate SR, DR, or FR configuration depends on the required distance and optical architecture.
For these high-speed systems, engineers should evaluate total link loss together with receiver sensitivity, transmitter output power, optical return loss, dispersion, FEC requirements, and the transceiver's specified operating conditions.
9. How to Measure Fiber Attenuation and Verify Link Performance
Theoretical calculations provide an initial design estimate, but installed fiber links should be tested before being placed into service. Testing confirms whether the actual optical path meets the required loss budget.
| Test Method | Primary Function | Typical Application |
|---|---|---|
| Optical Power Meter and Light Source | Measures end-to-end insertion loss | Fiber link acceptance testing |
| OLTS | Measures optical loss across the link | Structured cabling certification |
| OTDR | Identifies and locates fiber events and loss changes | Fault location and cable troubleshooting |
| Transceiver DDM / DOM | Reports module optical transmit and receive power when supported | Live link monitoring and diagnostics |
An OTDR is useful for locating events such as splices, connectors, and fiber breaks, but it does not replace end-to-end insertion-loss testing. A light source and optical power meter, or an appropriate OLTS, should be used when verifying the total loss of an installed link.
10. Conclusion
Fiber attenuation is one of the fundamental factors determining optical transmission distance. Every kilometer of fiber consumes part of the available optical power budget, while connectors, splices, bends, and passive components add further losses.
Choosing a suitable fiber category, operating wavelength, and optical transceiver helps establish the required link reach. Accurate loss calculations and field measurements then verify that the complete optical path can operate within the system's specifications.
For 400G, 800G, and other high-speed optical networks, a reliable design must consider attenuation alongside dispersion, receiver sensitivity, optical power limits, and the requirements of the selected transceiver interface.
For optical transceiver selection and fiber connectivity requirements, visit C-LIGHT or Contact C-LIGHT.
 >

 >
 >
 >
 >
 >
 >
 >