TEL:+86 132 6656 7067




1. Fundamentals and Physical Meaning of S-Parameters
1.1 Basic Concept
S-parameters (Scattering Parameters) analyze multi-port RF/microwave networks by evaluating the ratio between incident waves and reflected waves.Unlike traditional impedance parameters such as Z-parameters and Y-parameters, S-parameters are more suitable for high-frequency systems and 50Ω impedance environments, making them widely used in high-speed signal integrity testing.
1.2 Conversion Formulas
① Return Loss
[Return\ Loss = -20log|S11|]
② Insertion Loss
[Insertion\ Loss \approx -20log|S21|]
(when no signal gain exists)
1.3 Detailed Interpretation of S-Parameters
1.3.1 Single-Ended S-Parameters
(Coaxial and Single-Ended Signal Lines)
S11 / S22 — Reflection Parameters
S11: Reflection coefficient at Port 1 input, representing input return loss.
S22: Reflection coefficient at Port 2 output, representing output return loss.
Poor impedance matching causes standing waves, where reflected signals interfere with transmitted signals and introduce waveform distortion.
S21 / S12 — Transmission and Isolation Parameters
S21: Forward transmission coefficient, representing forward insertion loss.
S12: Reverse transmission coefficient, representing isolation between ports.
A more negative S12 value indicates better isolation between ports.
1.3.2 Time-Domain Differential Impedance Tdd11/Tdd22
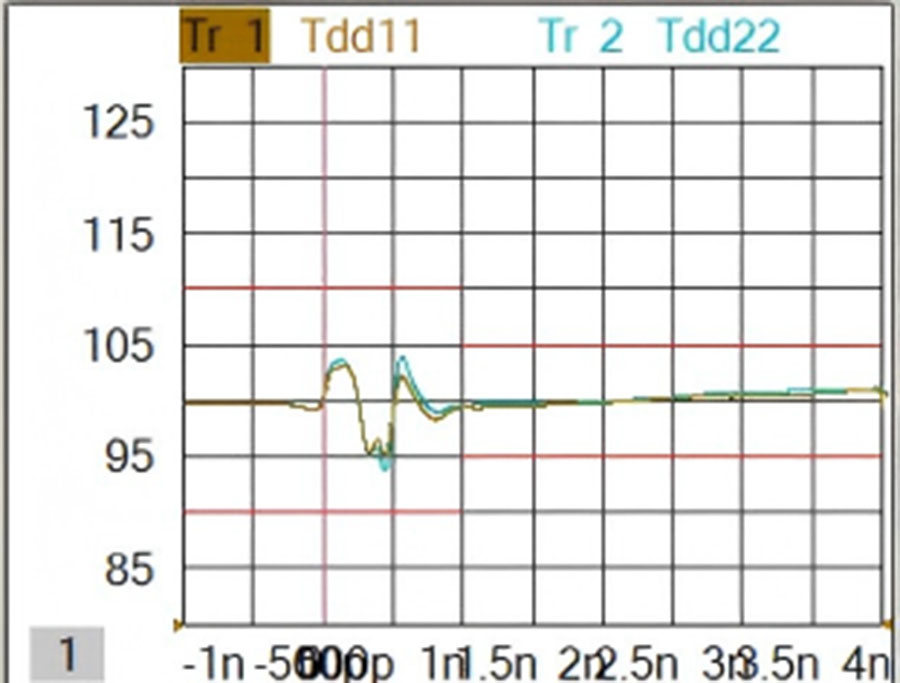
TDR (Time Domain Reflectometry) measures impedance by analyzing reflections generated by a step pulse.
Standard differential systems typically use a nominal impedance of 100Ω, with an allowable tolerance of:
±10% (90Ω–110Ω).
Impedance Discontinuity Characteristics
Abnormal fluctuations or sudden changes in the impedance curve indicate impedance discontinuities, usually caused by:
Connector transitions
Layer changes in PCB structures
Trace width variations
Differential Pair Symmetry Issues
An asymmetric Tdd11/Tdd22 waveform usually indicates:
Unequal differential pair routing lengths
Poor symmetry between differential traces
These issues directly introduce mode conversion noise.
TDR Measurement Requirements
During testing, the following must be applied:
Deskew time alignment
Loss compensation
Otherwise, waveform slope distortion may occur, causing inaccurate Scd mode conversion measurements.
1.3.3 Differential Mode S-Parameters (Sdd Series)
(Effective Differential Signal Transmission)
Sdd11 / Sdd22 — Differential Return Loss
Sdd11/Sdd22 represent the amount of signal reflection in a differential channel.
According to IEEE 802.3 standards, minimum return-loss limits are defined across different frequency ranges.
More negative values indicate better impedance matching.
Poor matching results in degraded eye diagrams and increased jitter.
Sdd21 — Differential Insertion Loss
Sdd21 represents attenuation of differential-mode signals during transmission.
At high frequencies:
Dielectric loss increases.
Copper skin effect becomes stronger.
Signal attenuation rises rapidly.
Therefore, Sdd21 is one of the key limiting factors for maximum transmission distance in high-speed links.
1.3.4 Common Mode S-Parameters (Scc Series)
(Noise and Interference Signals)
Scc11 / Scc22 — Common Mode Return Loss
Scc11/Scc22 describe the reflection capability of common-mode noise signals at ports.
When these parameters degrade:
Common-mode noise repeatedly reflects inside the link.
Noise accumulation increases.
EMI radiation may exceed limits and interfere with surrounding circuits.
1.3.5 Mode Conversion Parameters (Scd)
Scd11 / Scd22 — Differential-to-Common Mode Reflection Conversion
These parameters represent the ratio of differential signal reflection converted into common-mode noise.
Higher curve levels indicate:
Differential pair imbalance
Large length mismatch
Unequal trace widths
Scd21 — Differential-to-Common Mode Transmission Conversion
Scd21 represents the amount of differential signal converted into common-mode noise when transmitted to the far end.
Scd21-Sdd21 — Relative Mode Conversion Loss
This parameter evaluates the difference between:
Effective differential signal transmission
Generated common-mode noise
A larger difference indicates stronger noise suppression capability.
A small difference may lead to:
Increased radiation interference
Higher receiver-side bit error rate (BER)
1.3.6 Evaluation Metrics
Insertion Loss Deviation (ILD)
Insertion Loss Deviation (ILD) refers to the difference between the measured Sdd21 insertion loss curve and the cubic fitted curve defined by the protocol standard.
It is used to evaluate the linearity and consistency of insertion loss characteristics.
The commonly accepted industry requirement is:
ILD ≤ ±1 dB
A larger deviation indicates that signal attenuation varies significantly at different frequencies, which may cause:
Signal distortion in modulation
Increased Error Vector Magnitude (EVM)
Degraded high-speed link performance
NEXT (Near-End Crosstalk)
NEXT represents the coupling interference from one differential channel to an adjacent differential channel at the transmitter side.
It describes how much signal energy from the transmitting channel leaks into a nearby receiving channel at the same end.
Characteristics:
Higher transmission rates result in stronger crosstalk.
A more negative NEXT value indicates better channel isolation.
2. Common S-Parameter Measurement Methods and Test Conditions
2.1 Test Preparation
2.1.1 Instrument Calibration
A four-port Vector Network Analyzer (VNA) must perform:
SOLT calibration
ECal calibration
before measurement.
When using the TDR measurement mode, additional TDR time-domain calibration is required.
Calibration Configuration Requirements
The following calibration parameters must be correctly configured:
Port numbering
Connector type (such as APC 2.4 mm)
Connector gender
Corresponding calibration kit model
After calibration:
Test cables
Connectors
Adapters
must not be moved, otherwise the calibration accuracy will be compromised.
2.1.2 Test Hardware and Port Definition
Standard Impedance
Single-ended port impedance: 50Ω
Differential equivalent impedance: 100Ω
Differential measurements require dedicated differential fixtures to ensure:
Equal-length routing
Differential symmetry
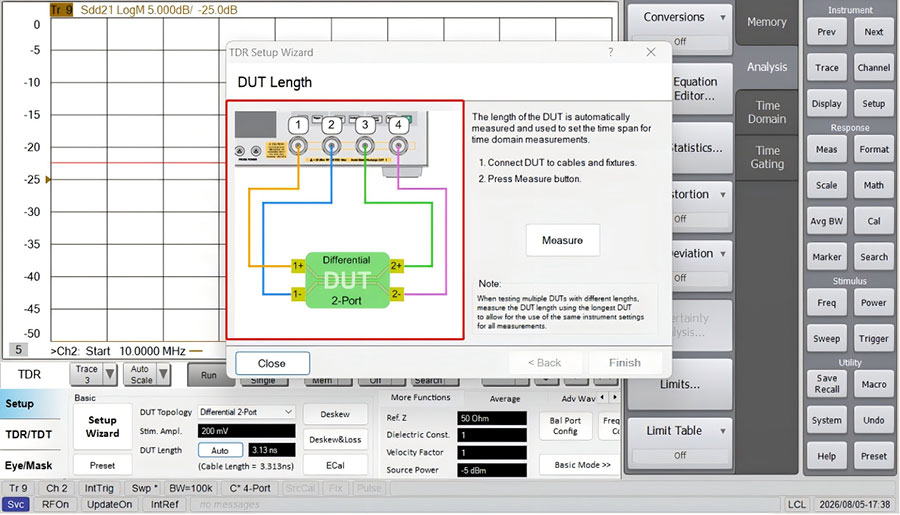
Port Assignment Specification
Typical differential port assignment:
Differential input: Port 1+ / Port 2-
Differential output: Port 3+ / Port 4-
Unused ports must be terminated with 50Ω matching loads.
Otherwise, open-port reflections may introduce measurement errors.
2.1.3 General Instrument Configuration Parameters
Frequency Range
The frequency range should be configured according to the product specification.
Common setting:
100 kHz ~ 40 GHz
IFBW (Intermediate Frequency Bandwidth)
Recommended setting:
IFBW = 1 kHz
Purpose:
Reduce measurement noise floor
Improve curve stability
If bandwidth is too large:
Noise level increases
Curve spikes appear
False failures may occur
Trace Smoothing
Enable trace smoothing to reduce random noise and improve measurement stability.
2.2 Common S-Parameter Measurement Methods
2.2.1 Differential Impedance (Tdd11/Tdd22) — Ω
Measurement Principle
TDR (Time Domain Reflectometry) measures differential impedance by analyzing reflection coefficients generated by a step signal.
It evaluates the impedance matching condition of the high-speed transmission channel.
Connection Method
Connect:
Port 1 / Port 2 → Differential Pair A input
The opposite end can be:
Floating
Connected to a matching load
Measurement Procedure
① Load the testing template:
File → Recall Status
② Differential impedance measurement requires:
Deskew time alignment
Loss compensation
Without compensation:
The impedance curve may show incorrect slope.
Scd measurement results may become inaccurate.

③ Switch to:
TDR Mode
Select:
Differential Impedance Measurement

④ Set rise time:
Typical value:
200 ps
(corresponding to approximately 10 GHz bandwidth)
Acceptance Criteria
Typical high-speed link requirement:
100Ω ±10%
2.2.2 Differential Return Loss (Sdd11/Sdd22) — dB
Measurement Principle
Differential return loss represents the reflection coefficient of a differential signal at the port and evaluates the impedance matching performance of the differential transmission channel.
A more negative value indicates better impedance matching performance.

Connection Method
Connect:
Port 1 / Port 2 → Differential Pair A input
The opposite end should be connected to a matching load.
Measurement Procedure
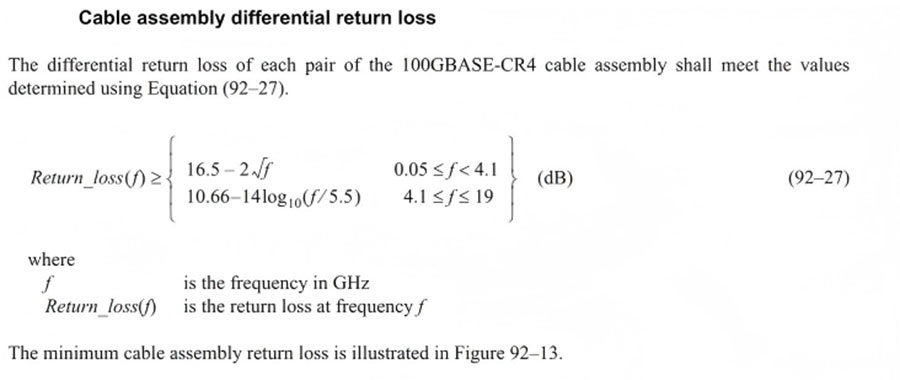
① Select measurement parameter:
Sdd11 (or Sdd22)
Set display format:
dB
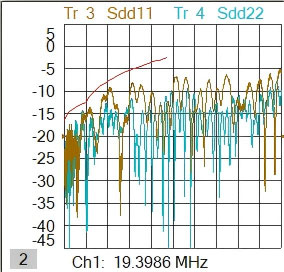
② After calibration, directly read the measurement curve.
According to IEEE 802.3bj/by standards for 25G/100G CR4 cables, segmented frequency range return-loss limit formulas are provided.
The cable passes the test only when the entire curve remains below the specified standard limit line.
2.2.3 Common Mode Return Loss (Scc11/Scc22) — dB
Measurement Principle
Common-mode return loss represents the reflection coefficient of common-mode signals at the port.
It evaluates the capability of the link to suppress common-mode noise.
A more negative value indicates better common-mode noise suppression performance.
Connection Method
The connection method is the same as differential return loss measurement.
The instrument automatically excites the common-mode signal:
Port 1 / Port 2 transmit an in-phase signal.
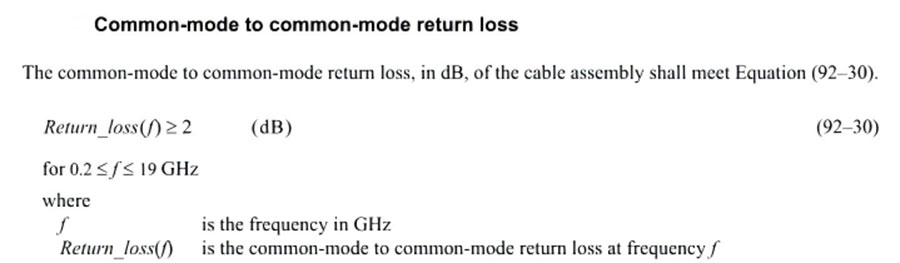
Measurement Procedure
① Select measurement parameter:
Scc11
Set display format:
dB
② Check the full-frequency response curve.
A more negative curve indicates stronger suppression of common-mode noise.
Poor common-mode return loss performance may lead to:
EMI problems
Excessive electromagnetic radiation
For 100G CR4 / 25G CR4, testing follows:
IEEE 802.3bj/by specifications
2.2.4 Mode Conversion Return Loss (Scd11/Scd22) — dB
Measurement Principle
Mode conversion return loss represents the ratio of differential-mode reflected signals converted into common-mode noise.
It evaluates the symmetry of the differential pair.
A more negative value indicates better differential pair balance.
Connection Method
The connection method is the same as differential return loss measurement.
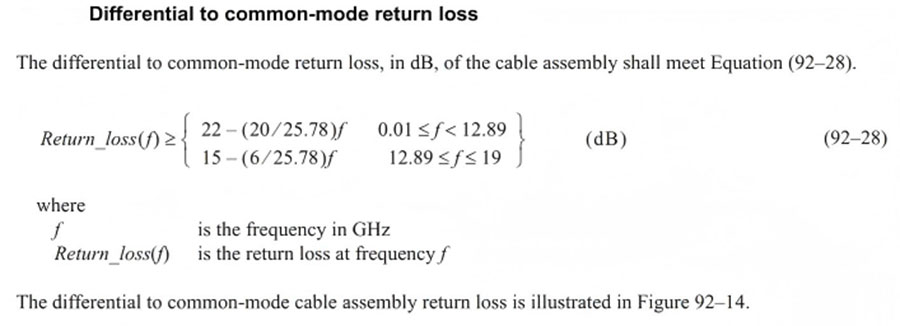
Measurement Procedure
① Select measurement parameter:
Scd11
(Conversion from differential mode to common mode during reflection)
Set display format:
dB
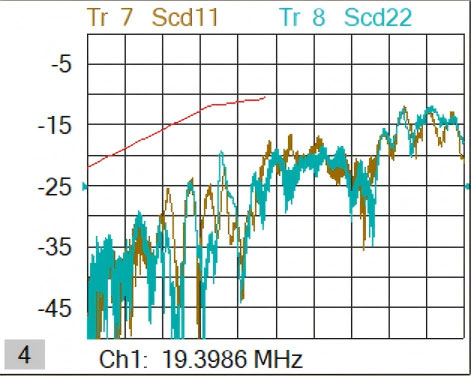
② If the curve exceeds the specified limit, it indicates differential pair imbalance.
Common root causes include:
Differential trace length mismatch
Trace routing offset
Asymmetric pad structures
For 100G CR4 / 25G CR4, testing follows:
IEEE 802.3bj/by specifications
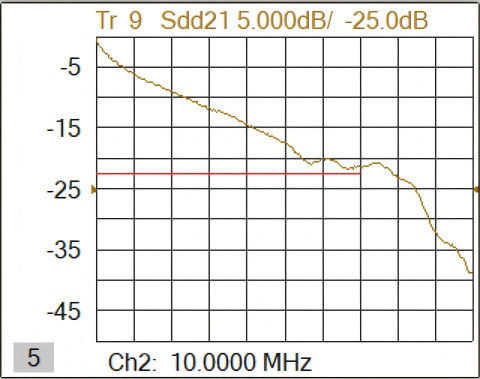
2.2.5 Insertion Loss (Sdd21) — dB
Measurement Principle
Sdd21 represents the attenuation of a differential signal transmitted from Port 1 to Port 2.
It evaluates the transmission loss of the differential channel.
A value closer to 0 dB indicates lower signal loss and better transmission performance.
Connection Method
Connect:
Input: Port 1 / Port 2
Output: Port 3 / Port 4
All ports are connected to the instrument to form a complete differential transmission path.
At high frequencies, insertion loss continuously increases and becomes one of the major limitations for high-speed transmission distance.
Measurement Procedure
① Select measurement parameter:
Sdd21
Set display format:
dB
② Read the insertion loss curve across the entire frequency range.
High-frequency attenuation must comply with protocol requirements.
2.2.6 Mode Conversion and Insertion Loss Difference (Scd21 - Sdd21) — dB
Measurement Principle
The Scd21 - Sdd21 parameter represents the difference between:
Scd21: The amount of differential-mode signal converted into common-mode noise during transmission.
Sdd21: The insertion loss of the differential-mode signal.
This parameter evaluates the mode conversion suppression capability of the transmission channel.
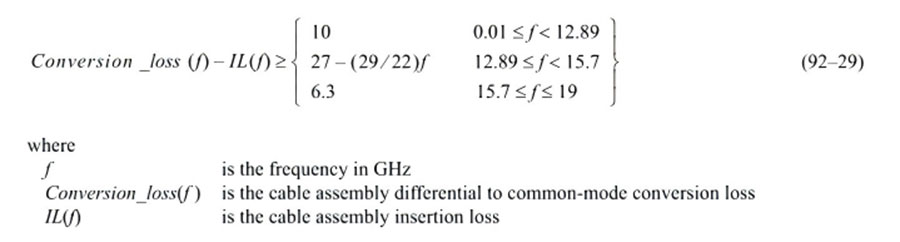
A larger difference indicates:
Better suppression of common-mode noise
Better differential signal integrity
Connection Method
The connection method is the same as differential insertion loss measurement.
Measurement Procedure
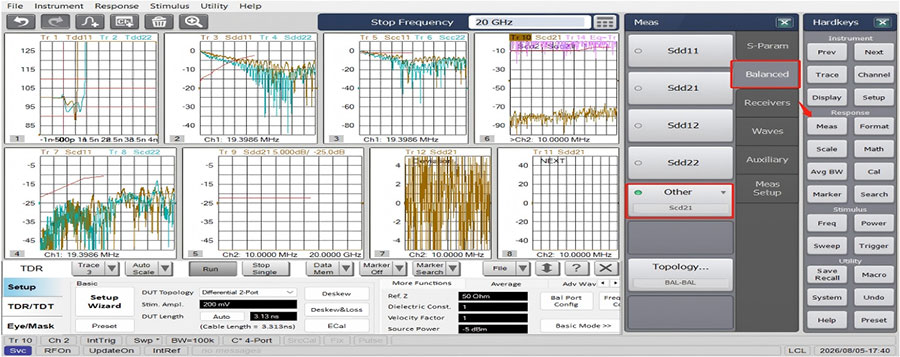
① Measure both:
Scd21
Sdd21
Set both measurement formats to:
dB
② Use the instrument's mathematical calculation function:
Math → Equation Editor
Configure:
Tr10 / Tr9
Add the mathematical operation trace:
[Math = Trace(Scd21) \backslash Trace(Sdd21)]
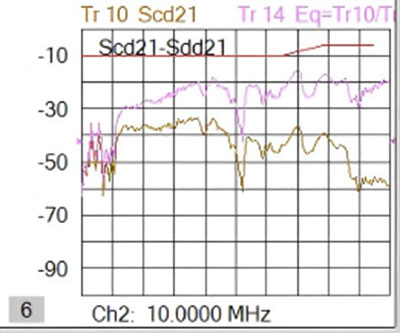
③ Check the difference across the full frequency range.
A smaller difference indicates:
Higher common-mode noise generation
Poorer mode conversion suppression capability
2.2.7 Insertion Loss Deviation (ILD)
Measurement Principle
Insertion Loss Deviation (ILD) is the difference between:
The measured insertion loss curve
The fitted curve defined by the protocol standard
It evaluates the linearity of insertion loss characteristics.
A smaller deviation indicates better signal transmission consistency.
Connection Method
The connection method is the same as differential insertion loss measurement.
ILD calculation is based on the Sdd21 measurement result.
Measurement Procedure
① Complete the Sdd21 measurement first.
② Use the instrument or dedicated analysis software.
According to the protocol algorithm (such as IEEE 802.3):
Perform linear fitting on the Sdd21 curve.
Calculate the insertion loss deviation between the measured curve and the fitted curve.
Example operation:
Meas-balanced-(topology=bal-bal)-Sdd21

Then:

Math → Analysis → Trace Deviation = Cubic
This displays the difference between the measured curve and the third-order polynomial fitted curve.
③ Calculate the difference between:
Measured value
Fitted value
at each frequency point.
This difference is defined as:
ILD
Acceptance criteria:
Typically:
ILD ≤ ±1 dB
(depending on the protocol requirements)
2.2.8 Near-End Crosstalk (NEXT) — dB
Measurement Principle
NEXT evaluates the interference from one differential pair to an adjacent differential pair at the transmitting end.
It measures the isolation capability between channels.
A more negative value indicates better crosstalk suppression.
Connection Method
Connect:
Port 1 / Port 2 → Differential Pair A input (transmitting channel)
Port 3 / Port 4 → Differential Pair B input (near-end receiving channel)
The far ends of both differential pairs should be connected to matching loads.
Measurement Procedure
① Select measurement parameter:
Sdd21
(for crosstalk from Differential Pair A → Differential Pair B)
Set display format:
dB
② Check the complete frequency response curve.
The critical frequency points must meet the requirements defined by the applicable standards.
2.2.9 Common Measurement Errors
During S-parameter testing, common measurement errors include:
① Moving test cables or adapters after calibration
After calibration, moving:
Test cables
Connectors
Adapters
introduces additional reflection loss and affects measurement accuracy.
② Leaving unused ports open
Unused ports must not remain floating.
Open-circuit reflections may interfere with differential measurement results.
③ TDR measurement without deskew time alignment
Failure to perform time alignment compensation will cause:
Incorrect waveform response
Completely distorted mode conversion measurement results
④ Aging or resistance deviation of matching loads
Aged or inaccurate matching loads may cause:
False improvement of return loss
False degradation of crosstalk results
leading to inaccurate test conclusions.
⑤ Excessive IFBW setting
A large IFBW value may result in:
Higher measurement noise
More waveform spikes
Incorrect judgment of specification failures
3. Impact Analysis of Non-Ideal S-Parameters on System Performance
Non-ideal S-parameter characteristics in high-speed DAC links can directly affect signal integrity, electromagnetic compatibility, and overall system reliability.
The following sections analyze the impact of major abnormal S-parameter conditions on system performance.
3.1 Poor Impedance Matching (Sdd11 / Tdd11 Exceeding Limits)
When impedance matching is poor:
Signals undergo multiple reflections within the transmission channel.
Reflected signals superimpose with the original signal.
The receiver eye diagram becomes compressed.
Signal rising and falling edges become distorted.
Time-domain jitter increases significantly.
As a result:
The system bit error rate (BER) increases.
Standing waves may occur.
Localized heating effects may become more severe.
3.2 Excessive Differential Insertion Loss (Sdd21)
When differential insertion loss Sdd21 is too high:
High-frequency signal components suffer significant attenuation.
Amplitude imbalance occurs between low-frequency and high-frequency components.
The received signal amplitude decreases.
Signal-to-noise ratio (SNR) deteriorates.
This ultimately limits the maximum transmission distance of high-speed links.
3.3 Poor Mode Conversion Performance (Scd Parameters)
When Scd performance is poor:
A large portion of the differential-mode signal is converted into common-mode noise.
Common-mode noise radiates outward and causes electromagnetic interference.
The system may fail EMC (Electromagnetic Compatibility) testing.
In addition:
Common-mode noise superimposes on the valid signal.
Signal jitter increases.
Bit error rate (BER) rises.
3.4 Poor Common Mode Return Loss (Scc11)
When Scc11 performance is degraded:
Common-mode noise repeatedly reflects inside the transmission link.
Noise accumulates and becomes amplified.
Electromagnetic radiation interference becomes more severe.
3.5 Insufficient NEXT Isolation
When NEXT isolation is insufficient:
Multiple parallel channels interfere with each other.
Crosstalk between adjacent channels accumulates.
Data synchronization and timing become unstable.
For PAM4 modulation systems:
Crosstalk-induced errors become more significant.
Signal margin is reduced.
3.6 Excessive ILD and Non-Flat Group Delay
When ILD exceeds the specification limit:
Different frequency components experience unequal attenuation.
Signal propagation speed varies across frequency components.
Phase distortion occurs in high-speed signals.
Consequences:
Signal error amplitude increases.
Link performance degrades.
3.7 Insufficient Reverse Isolation (S12)
When reverse isolation S12 is insufficient:
Signals from different ports leak into each other.
Isolation between channels is reduced.
System signal-to-noise ratio decreases.
 >
>

 >
>
 >
>
 >
>
 >
>
 >
>
 >
>
 >
>