TEL:+86 132 6656 7067





In high-speed communication systems, signal integrity depends on more than whether a transmitter produces the correct data rate. Noise, timing variation, bandwidth limitations, reflections, and channel distortion can all affect how reliably a receiver identifies incoming symbols. An eye diagram brings these effects together in one measurement, making it an important tool for evaluating electrical and optical communication links.
1. What Is an Eye Diagram?
An eye diagram, also called an eye pattern, is a graphical representation of a digital signal created by overlapping multiple waveform segments over a common time reference. Each segment typically covers one or two unit intervals (UI), allowing repeated signal transitions to appear together on an oscilloscope display.
The overlapping waveforms form an eye-shaped opening. Its appearance reflects the combined effects of signal amplitude, timing accuracy, noise, intersymbol interference (ISI), and channel response.
The two main axes are:
Horizontal axis: Time, commonly expressed in unit intervals (UI). One UI represents one symbol period.
Vertical axis: Signal amplitude or voltage for an electrical measurement, or optical power for an optical measurement.
Illustrative NRZ eye pattern. The central opening indicates the available sampling margin.
A relatively open eye generally indicates better signal separation and timing margin. As impairments accumulate, the eye becomes narrower, shorter, or more distorted, indicating that the receiver has less margin when making data decisions.
2. What Does an Eye Diagram Reveal About Signal Quality?
An eye diagram helps engineers evaluate several signal characteristics at the same time. The most useful observations are related to vertical opening, horizontal opening, transition behavior, and waveform distribution.
| Measurement or Feature | What It Indicates | Potential Signal Issue |
|---|---|---|
| Eye height | Vertical separation between signal levels at the sampling region. | Noise, amplitude distortion, or reduced signal margin. |
| Eye width | Available timing window for reliable sampling. | Jitter, timing uncertainty, or intersymbol interference. |
| Crossing points | Consistency of transitions between signal levels. | Duty-cycle distortion, asymmetric transitions, or timing variation. |
| Rise and fall time | Speed of transitions between signal levels. | Limited bandwidth, slew-rate limitations, or channel distortion. |
| Waveform thickness | Variation among repeated signal traces. | Noise and timing fluctuations. |
| Overshoot and ringing | Behavior around signal transitions. | Impedance discontinuities, reflections, or channel effects. |
Eye Height: Vertical Signal Margin
Eye height describes the vertical opening between signal levels at the selected sampling point. A larger opening generally provides greater tolerance to amplitude noise and receiver threshold variation.
When noise increases or the signal levels become less distinct, the vertical opening decreases. If the available margin becomes too small, the receiver may have difficulty distinguishing adjacent signal states.
Eye Width: Timing Margin
Eye width represents the horizontal sampling window within which the receiver can make a reliable decision. A wider eye generally means greater tolerance to clock timing variation.
Jitter and intersymbol interference can shift transition locations and reduce this window. A narrow eye indicates that the receiver has less freedom to select a stable sampling instant.
Waveform Transitions and Distortion
Rise time and fall time describe how quickly the signal moves between levels. Slow or asymmetric transitions may indicate bandwidth limitations or differences in the channel response. Overshoot, ringing, and irregular crossing points can also reveal reflections and impedance-related problems.
3. How Do Noise, Jitter, and ISI Affect the Eye?
Several impairments can reduce eye opening. Although they may appear together on the same display, each affects signal quality in a different way.
Noise
Noise creates amplitude variation in the received waveform. Random noise tends to increase the vertical spread of the traces, reducing eye height and making signal-level decisions less reliable.
Jitter
Jitter is the deviation of signal transitions from their ideal timing positions. It increases horizontal waveform spread and can reduce eye width. Sources include clock instability, crosstalk, power-supply noise, and data-dependent timing effects.
Intersymbol Interference
Intersymbol interference occurs when the response to one transmitted symbol extends into neighboring symbol periods. Limited channel bandwidth, reflections, and dispersion can cause this effect. The resulting waveform depends partly on previous or subsequent symbols, producing distorted transitions and reduced eye opening.
Bandwidth Limitations
A communication channel with insufficient bandwidth cannot reproduce fast signal transitions accurately. This can increase rise and fall times, introduce waveform distortion, and contribute to ISI. The effect becomes increasingly important as signaling rates increase.
4. NRZ and PAM4 Eye Diagrams: Key Differences
The signaling format determines the number of amplitude levels and eye openings shown in the diagram. NRZ and PAM4 are especially important in high-speed optical communication because they use different approaches to transmit data.
| Characteristic | NRZ (PAM2) | PAM4 |
|---|---|---|
| Signal levels | 2 | 4 |
| Bits per symbol | 1 | 2 |
| Eye openings | 1 | 3 |
| Adjacent-level separation | Two-level decision | Three adjacent-level decision regions |
| Signal evaluation | Eye height, width, jitter, and eye mask. | Individual eye openings, level separation, noise, jitter, and PAM4-specific metrics. |
| Common applications | Many traditional serial interfaces and optical links. | High-speed 100G-per-lane and other advanced optical and electrical interfaces. |
NRZ uses two amplitude levels to represent binary data. Its eye diagram contains one main eye opening. PAM4 uses four amplitude levels and represents two bits per symbol, producing three vertically stacked eye openings.
Because PAM4 divides the available amplitude range among more signal levels, adjacent levels are more closely spaced than in a comparable two-level signal with the same overall amplitude range. This makes noise and level distortion particularly important when evaluating PAM4 signal quality.
Conceptual illustration of NRZ and PAM4 eye structures, not measured test data.
For PAM4 optical transmitters, TDECQ (Transmitter and Dispersion Eye Closure for PAM4) is an important standardized measurement. It evaluates transmitter performance under specified channel and reference-receiver conditions. A conventional visual inspection of the eye pattern alone does not replace the required TDECQ measurement.
5. How Is an Eye Diagram Measured?
Eye diagrams can be captured using an oscilloscope or a dedicated signal and eye-pattern analyzer. The measurement setup depends on whether the signal is electrical or optical, the data rate, the modulation format, and the applicable interface specification.
Typical Electrical Measurement Setup
Pattern generator: Generates a defined test pattern, often a pseudo-random bit sequence (PRBS).
Device under test: The transmitter, cable, connector, channel, or other component being evaluated.
Oscilloscope: Captures the electrical waveform with suitable bandwidth and sampling performance.
Clock recovery: Establishes the timing reference used to align and overlay waveform segments.
Analysis software: Displays the eye pattern and calculates measurements such as eye height, eye width, jitter, and mask margin.
Optical Eye Diagram Measurement
For an optical transmitter, the optical output is converted into an electrical waveform using an appropriate optical-to-electrical (O/E) converter or optical sampling instrument. The resulting waveform is then analyzed using a suitable oscilloscope or eye-pattern analyzer.
The optical test configuration must account for the wavelength, modulation format, symbol rate, receiver frequency response, and measurement requirements. PAM4 compliance testing may also require a defined reference receiver, equalization, test pattern, and standardized measurement procedure.
6. Eye Diagrams in Optical Transceiver and High-Speed Cable Testing
Eye diagrams are useful throughout high-speed network development and validation. They help engineers assess the quality of signal paths used in optical transceivers, direct-attach cables, active electrical cables, and optical interconnects.
| Application | What Engineers Evaluate | Why It Matters |
|---|---|---|
| Optical transceiver transmitter | Optical eye opening, level separation, jitter, and applicable transmitter metrics. | Verifies transmitter signal quality against the relevant interface requirements. |
| Optical receiver | Received signal quality, timing margin, and sensitivity-related performance. | Helps identify whether the receiver can distinguish incoming data reliably. |
| DAC and AEC cables | Electrical eye opening, insertion-loss effects, crosstalk, and timing margin. | Supports evaluation of high-speed electrical channel performance. |
| AOC links | Optical transmitter and receiver behavior, as well as electrical interfaces at the endpoints. | Helps assess signal integrity across active optical interconnects. |
| Switch and server interfaces | Transmitter output and receiver input signal margins. | Supports interface validation and interoperability testing. |
In 400G and 800G data center networks, signal integrity becomes increasingly important as lane speeds and interface complexity increase. PAM4 signaling, tighter electrical channel budgets, and high-density connections make waveform analysis an important part of design verification and production quality control.
C-LIGHT's high-speed connectivity portfolio includes 800G DAC cables, 800G AEC cables, and 800G AOC cables. These interconnect types use different electrical and optical transmission architectures, so their signal-integrity evaluation methods and test configurations must match the product design.
7. Eye Diagram vs. BER, Jitter, and TDECQ
An eye diagram provides a visual overview of signal behavior, but it is not interchangeable with other signal-quality measurements. Each metric evaluates a different aspect of link performance.
| Metric | Primary Purpose | Measurement Perspective |
|---|---|---|
| Eye diagram | Visualizes signal transitions and opening. | Combined waveform behavior over time. |
| BER | Measures the proportion of incorrectly received bits. | Actual or estimated data error performance. |
| Jitter | Quantifies timing variation. | Deviation of signal transitions from their ideal timing. |
| TDECQ | Evaluates PAM4 optical transmitter and link quality under defined conditions. | Standardized optical power-penalty measurement. |
| Eye mask | Defines an allowed region for waveform behavior. | Pass/fail evaluation against specified geometric limits. |
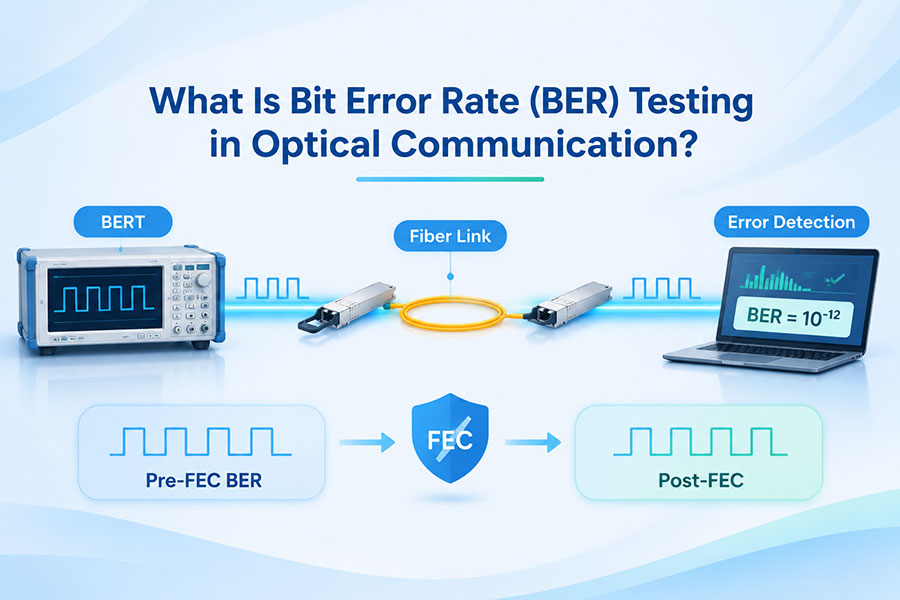
A visually open eye does not automatically guarantee a particular BER. BER testing provides direct information about data errors under the tested conditions, while eye measurements help identify waveform characteristics that may contribute to those errors. For PAM4 optical transmitters, TDECQ adds a standardized evaluation that cannot be inferred reliably from appearance alone.
8. Common Reasons for a Poor Eye Diagram
When an eye diagram shows reduced opening or irregular waveform behavior, engineers typically investigate the signal path and measurement setup. Common contributing factors include:
Excessive channel loss: Attenuation reduces signal amplitude and can worsen transition quality.
Impedance discontinuities: Connector, PCB, or cable mismatches can create reflections and ringing.
Excessive crosstalk: Coupling from adjacent signal paths introduces unwanted interference.
Clock instability: Timing variation reduces the available sampling window.
Insufficient bandwidth: Slow transitions and waveform distortion can increase ISI.
Optical dispersion: In optical links, dispersion can spread pulses and affect the received waveform.
Incorrect test configuration: Unsuitable probes, fixtures, clock recovery, or measurement settings can distort the displayed result.
A poor eye diagram should therefore be treated as an indication for further investigation, not as proof that one specific component has failed. Engineers should correlate waveform observations with BER, jitter, insertion loss, optical power, and other relevant measurements.
9. Conclusion
An eye diagram is a practical signal-integrity tool for evaluating high-speed electrical and optical communication links. Its vertical and horizontal openings reveal amplitude and timing margins, while waveform thickness, transition shape, and crossing behavior provide clues about noise, jitter, ISI, and channel distortion.
As data center networks move toward higher lane rates and increasingly rely on PAM4 signaling, eye analysis remains important for transmitter validation, receiver evaluation, and interconnect testing. However, reliable qualification requires more than visual inspection: engineers should combine eye diagrams with standardized measurements, BER testing, and interface-specific compliance requirements.
C-LIGHT provides optical transceivers and high-speed interconnect solutions for data center and network applications. For product specifications, compatibility requirements, or technical support, Contact C-LIGHT.
 >

 >
 >
 >
 >
 >
 >
 >